Know more. Guess less.
Biolyz combines accurate diagnostic analyses with smart data aggregation and recommendations. Data is analysed to generate actionable insights that support decision making and promote athlete health, recovery and performance capacity.
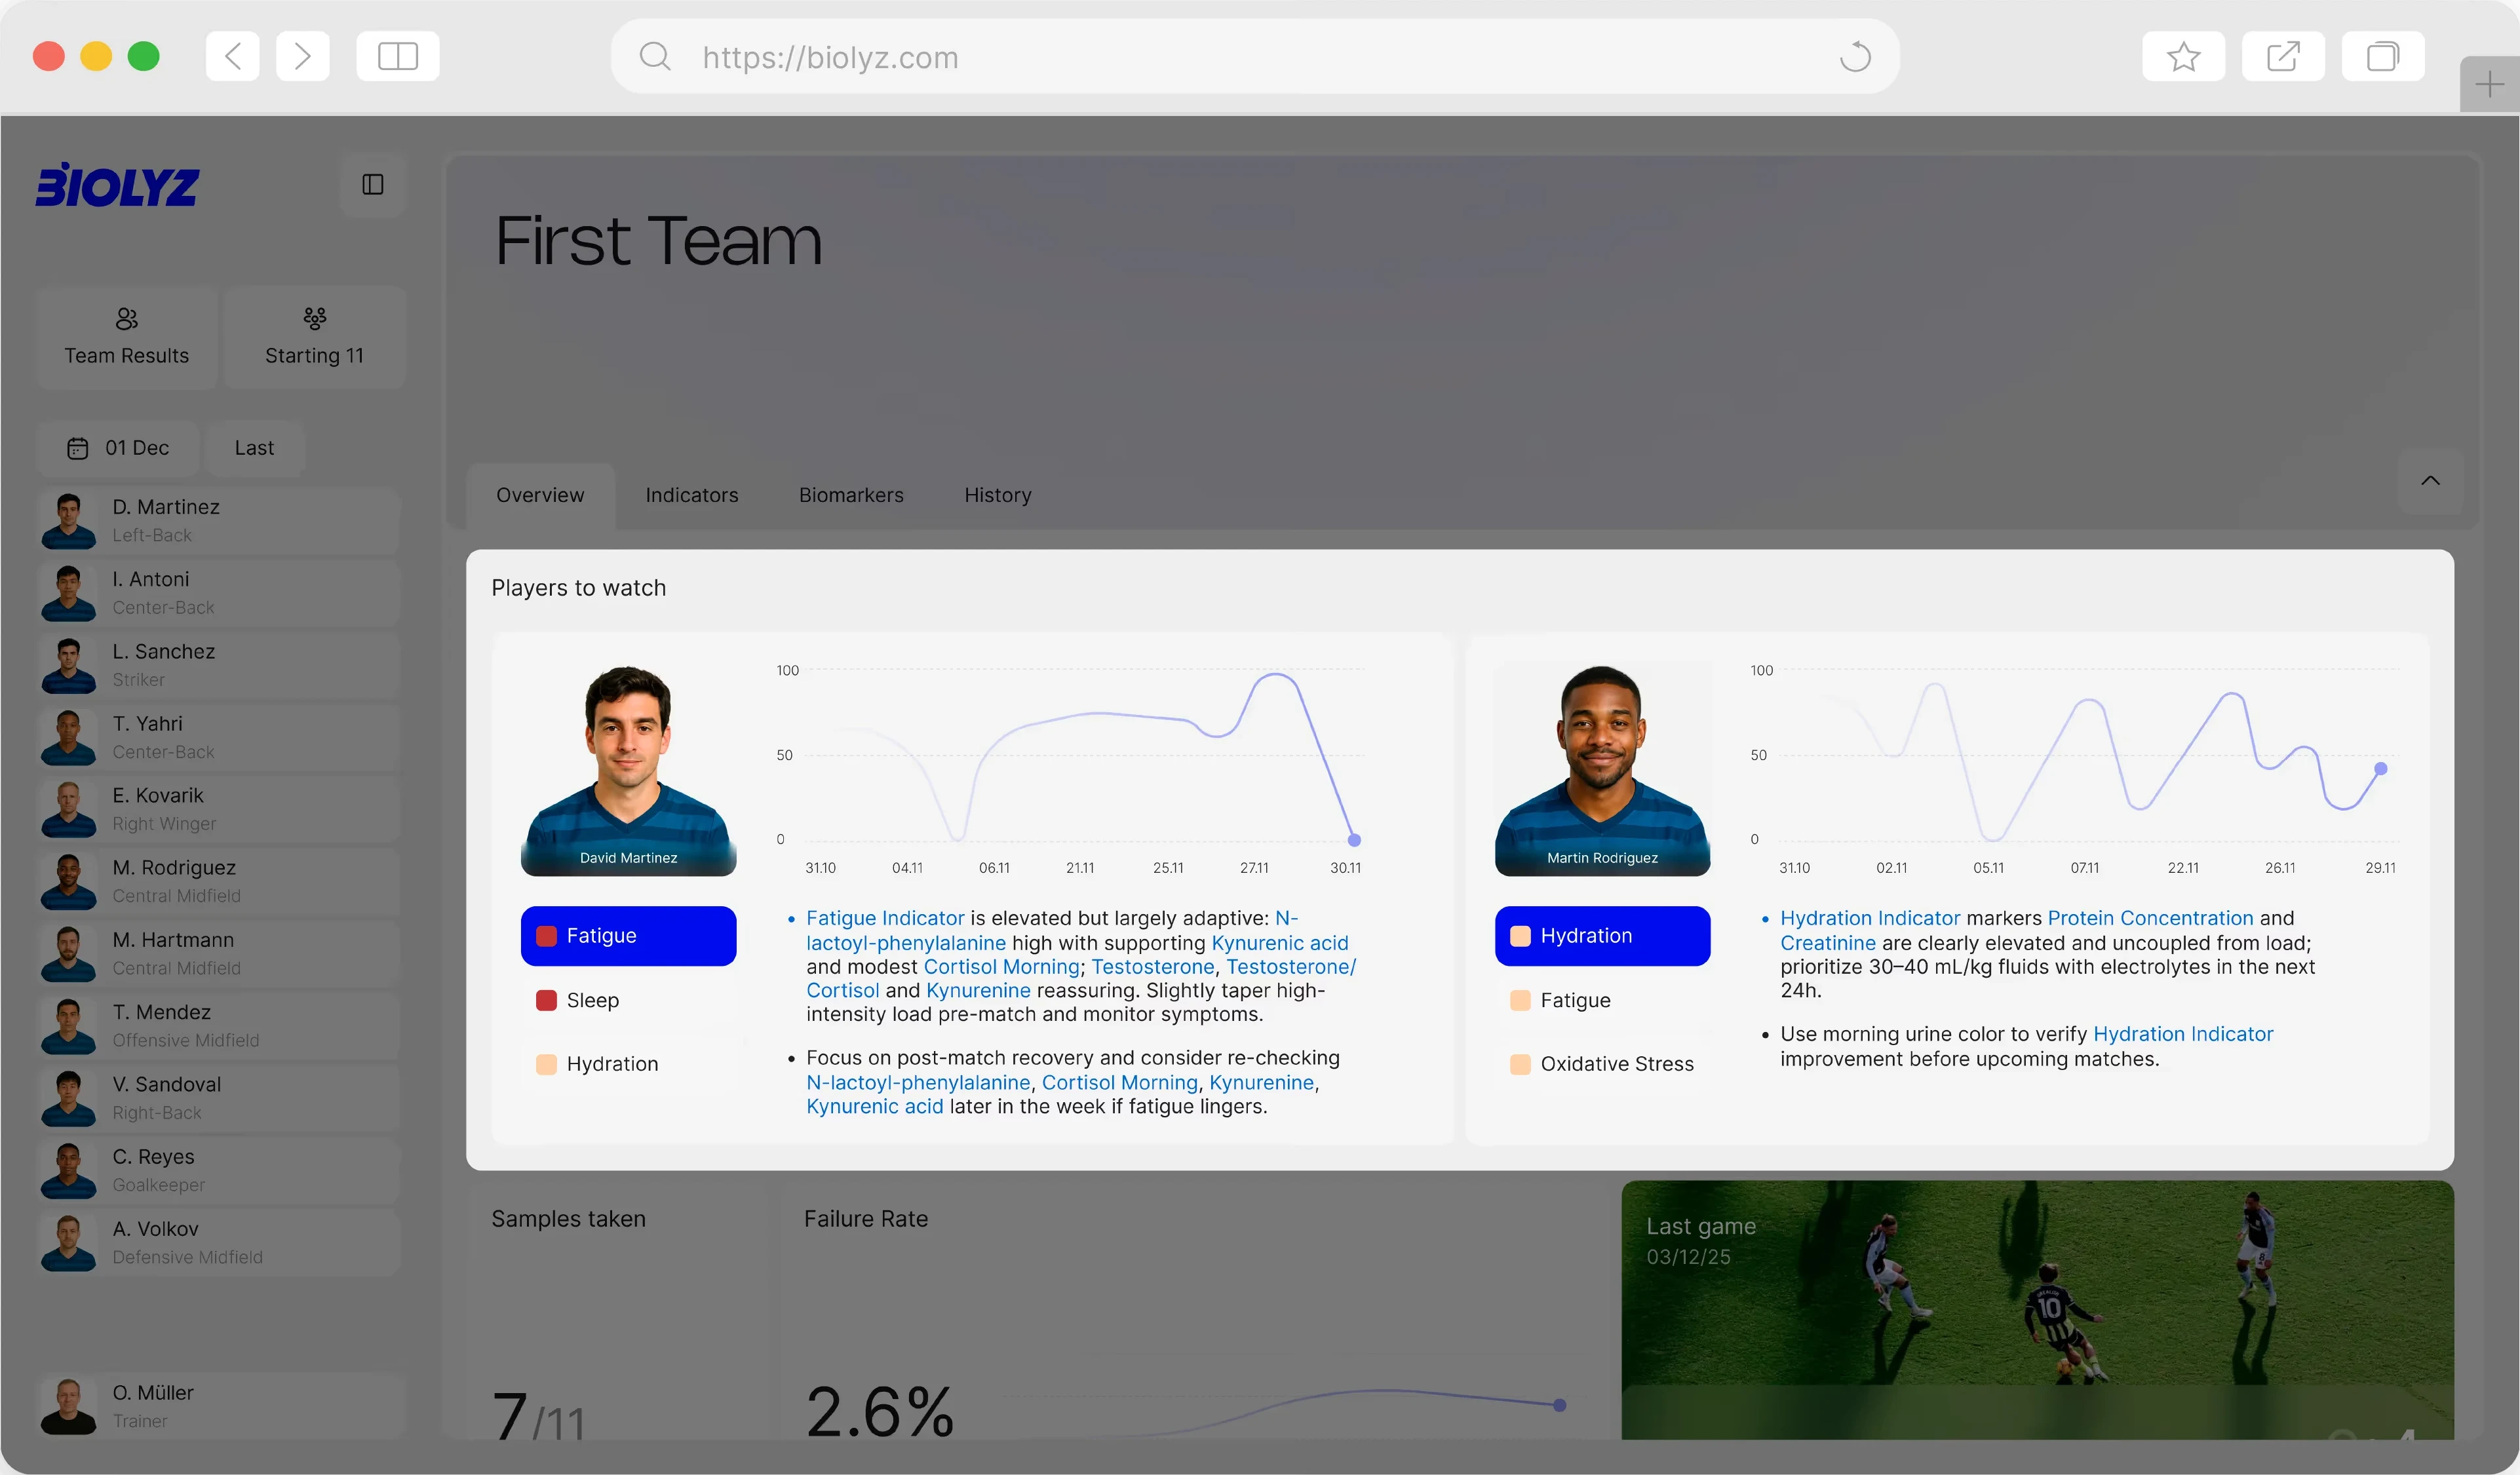
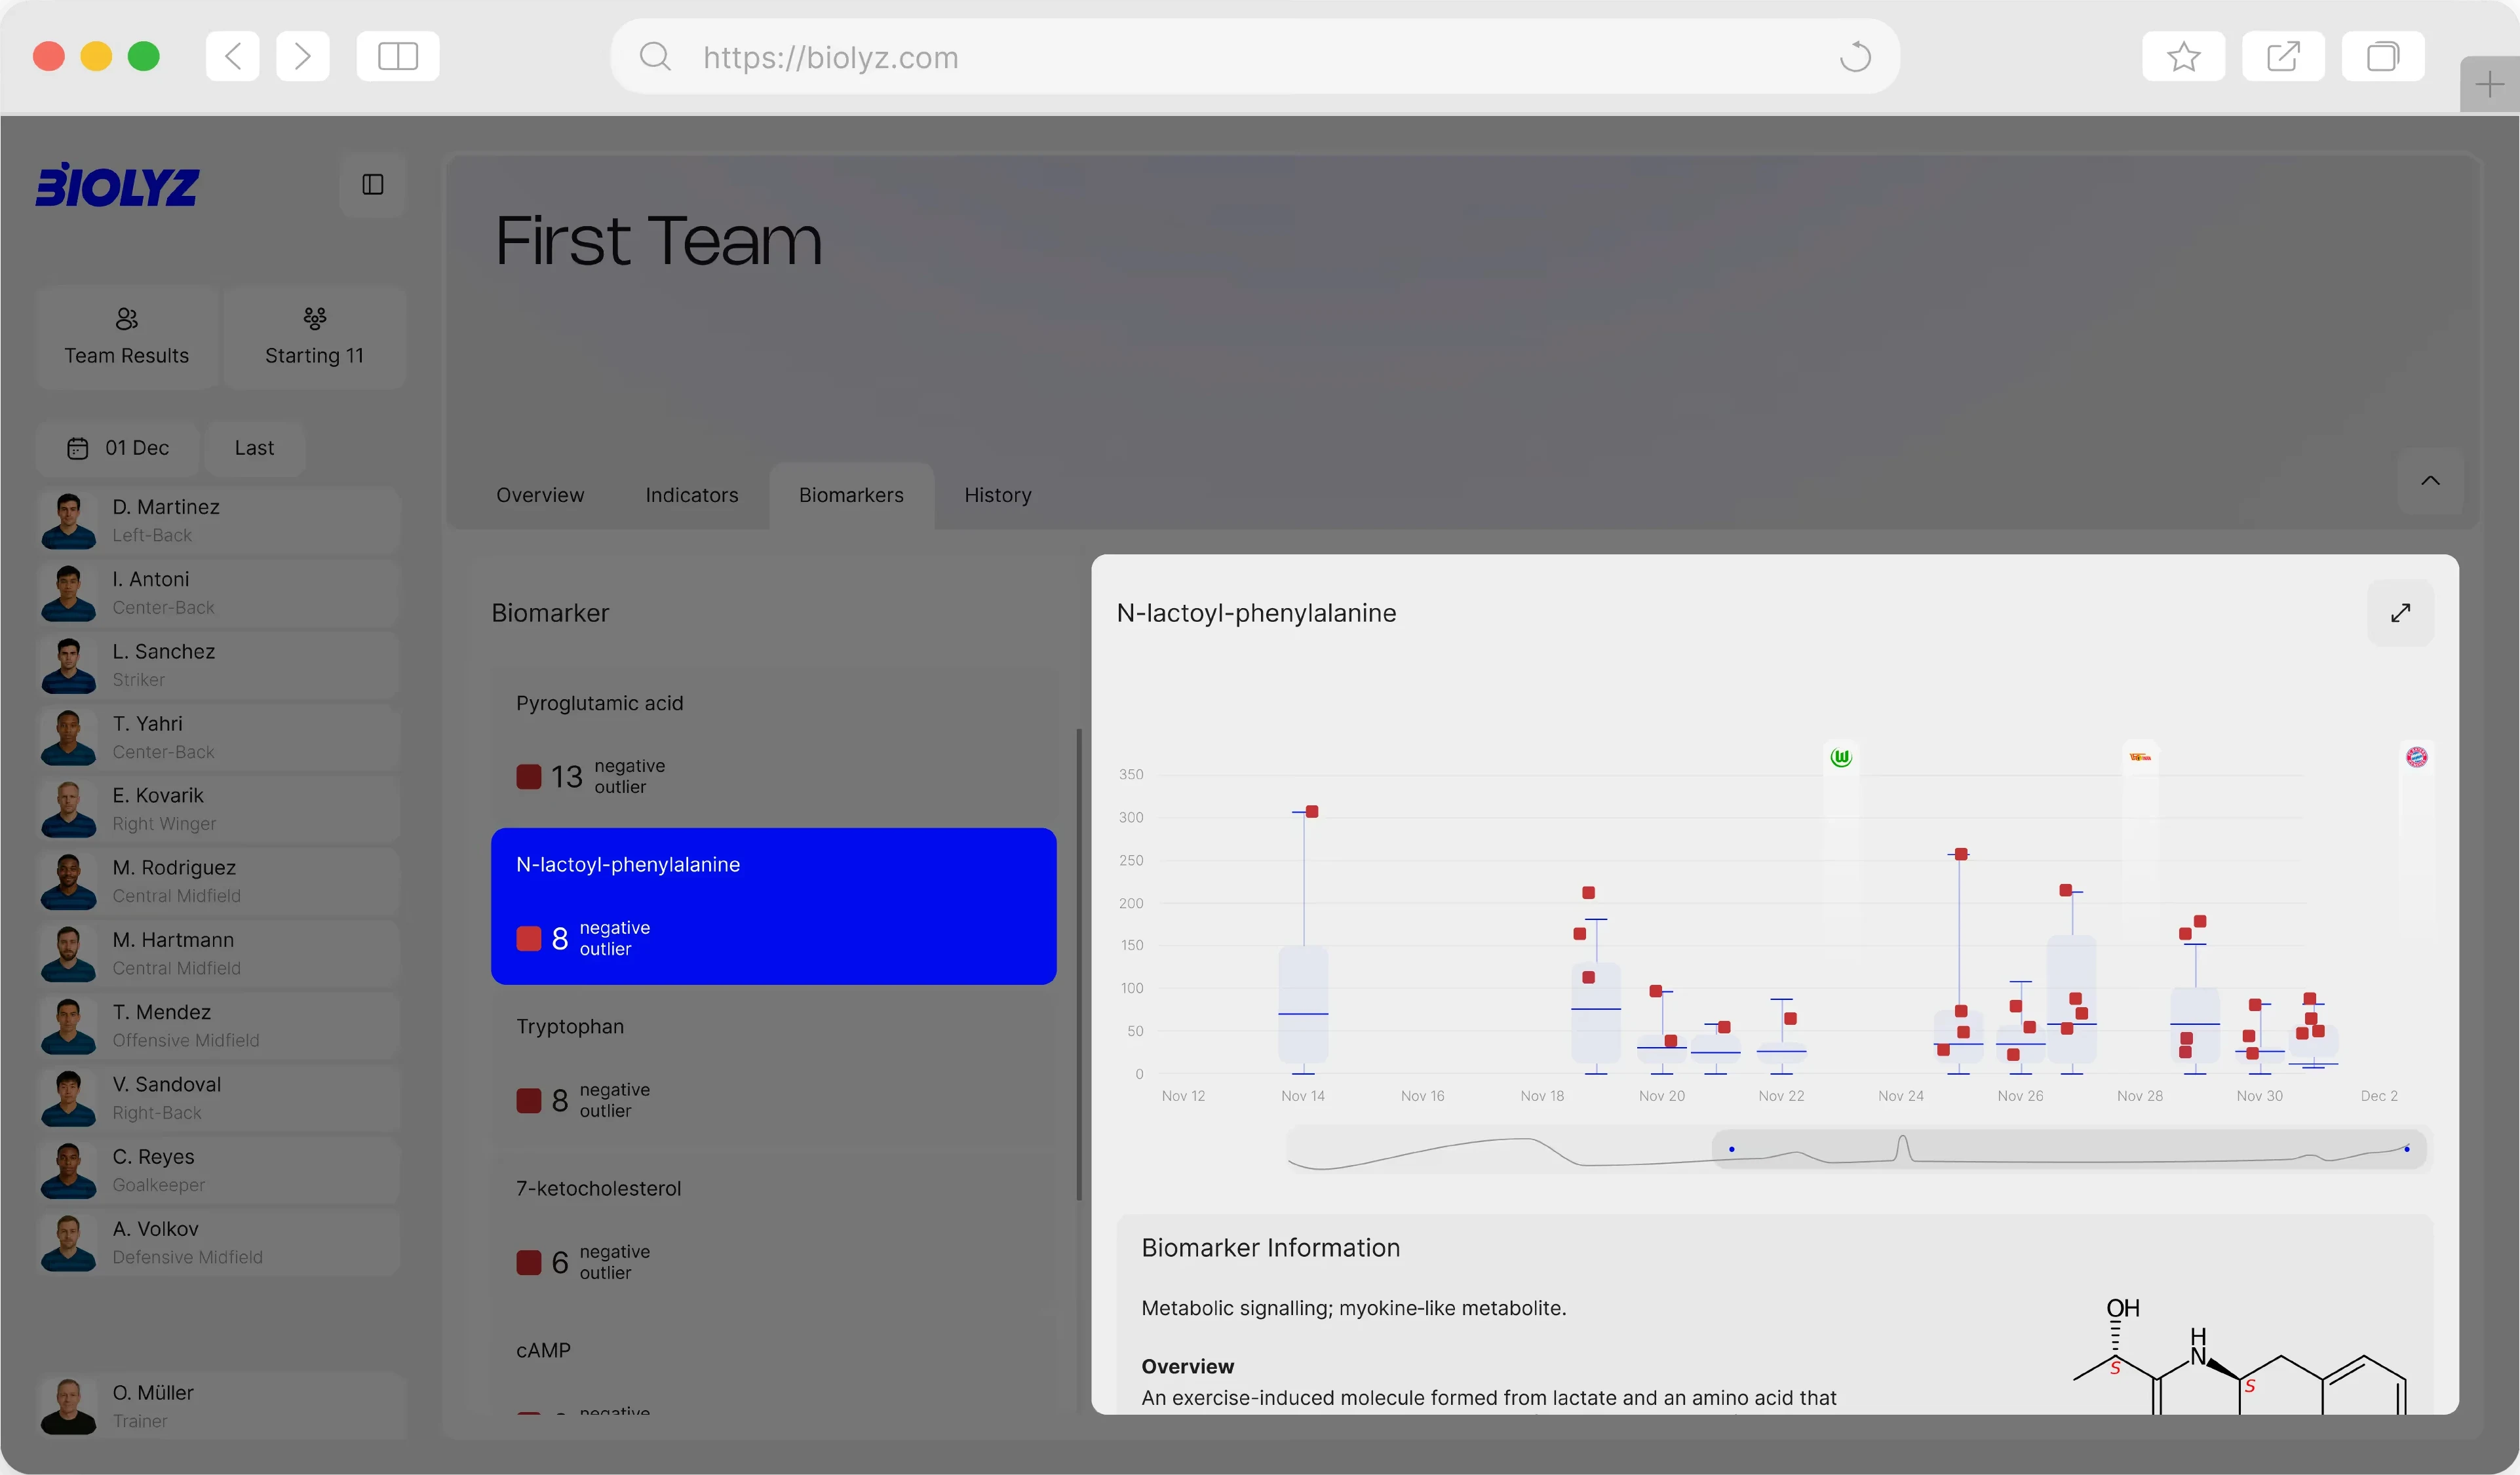
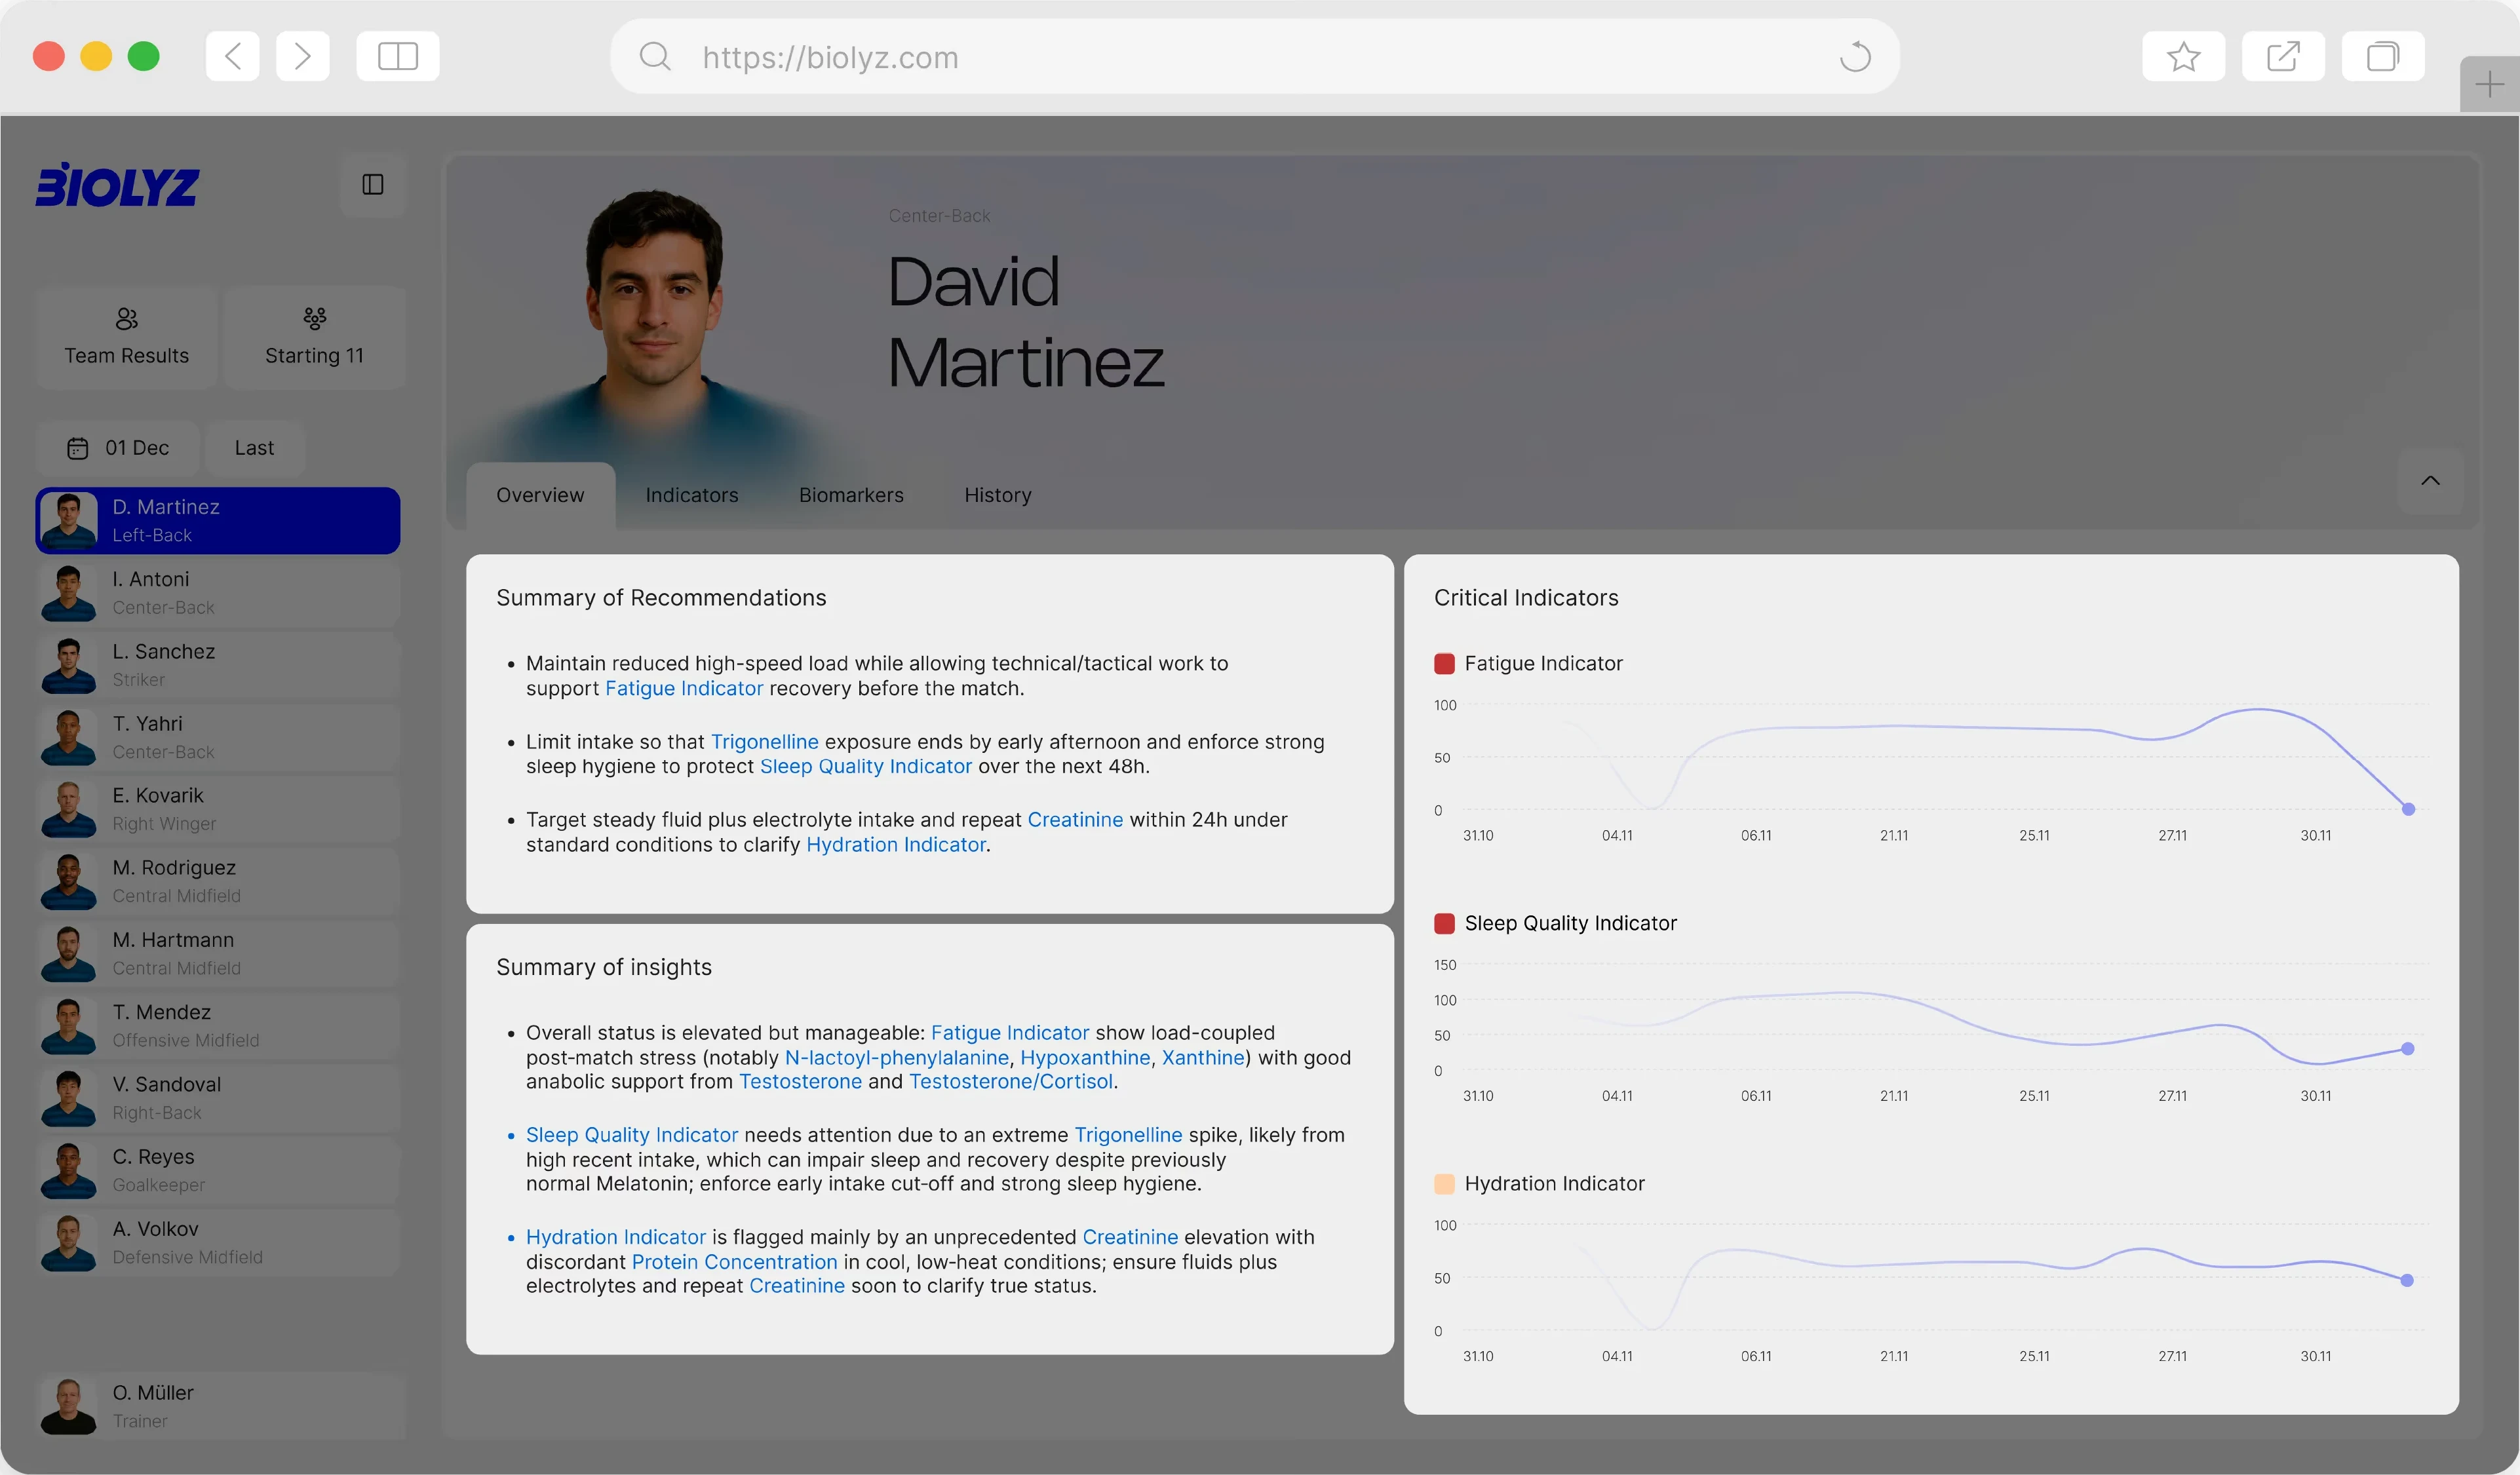
One dashboard, squad to single athlete
Switch from a full-team overview down to one player's biomarkers: the same data, one click away.
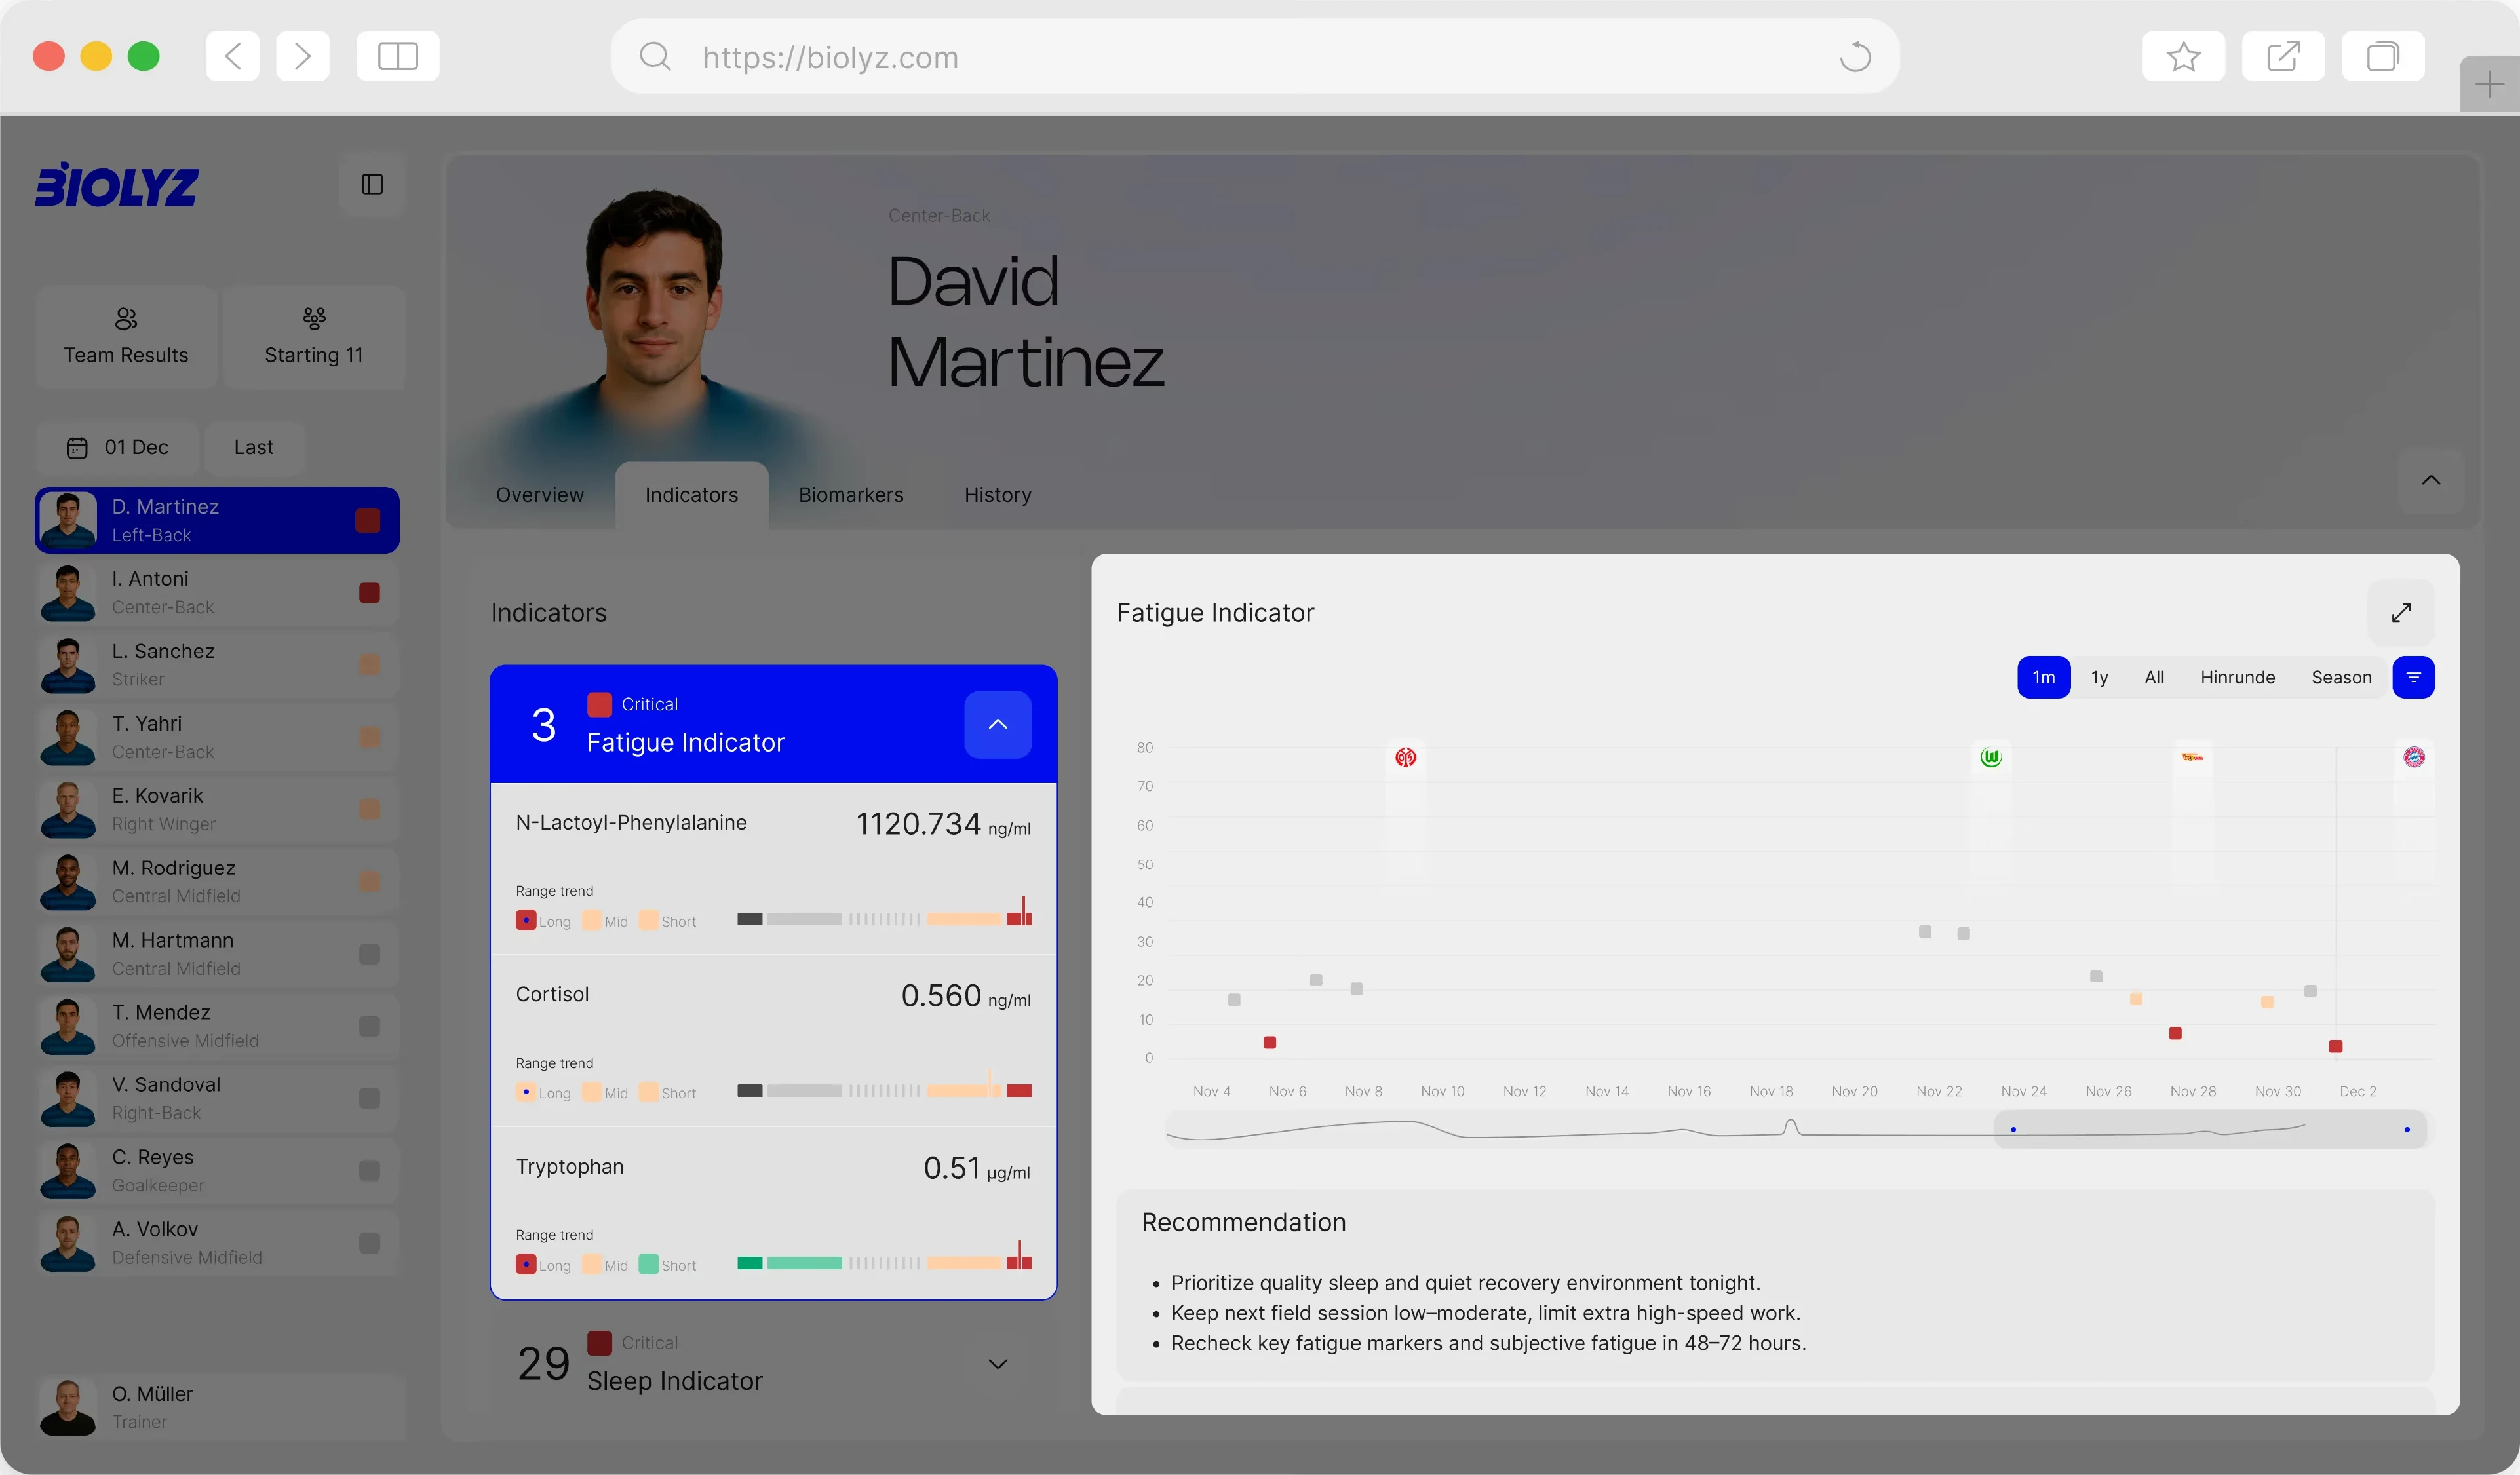
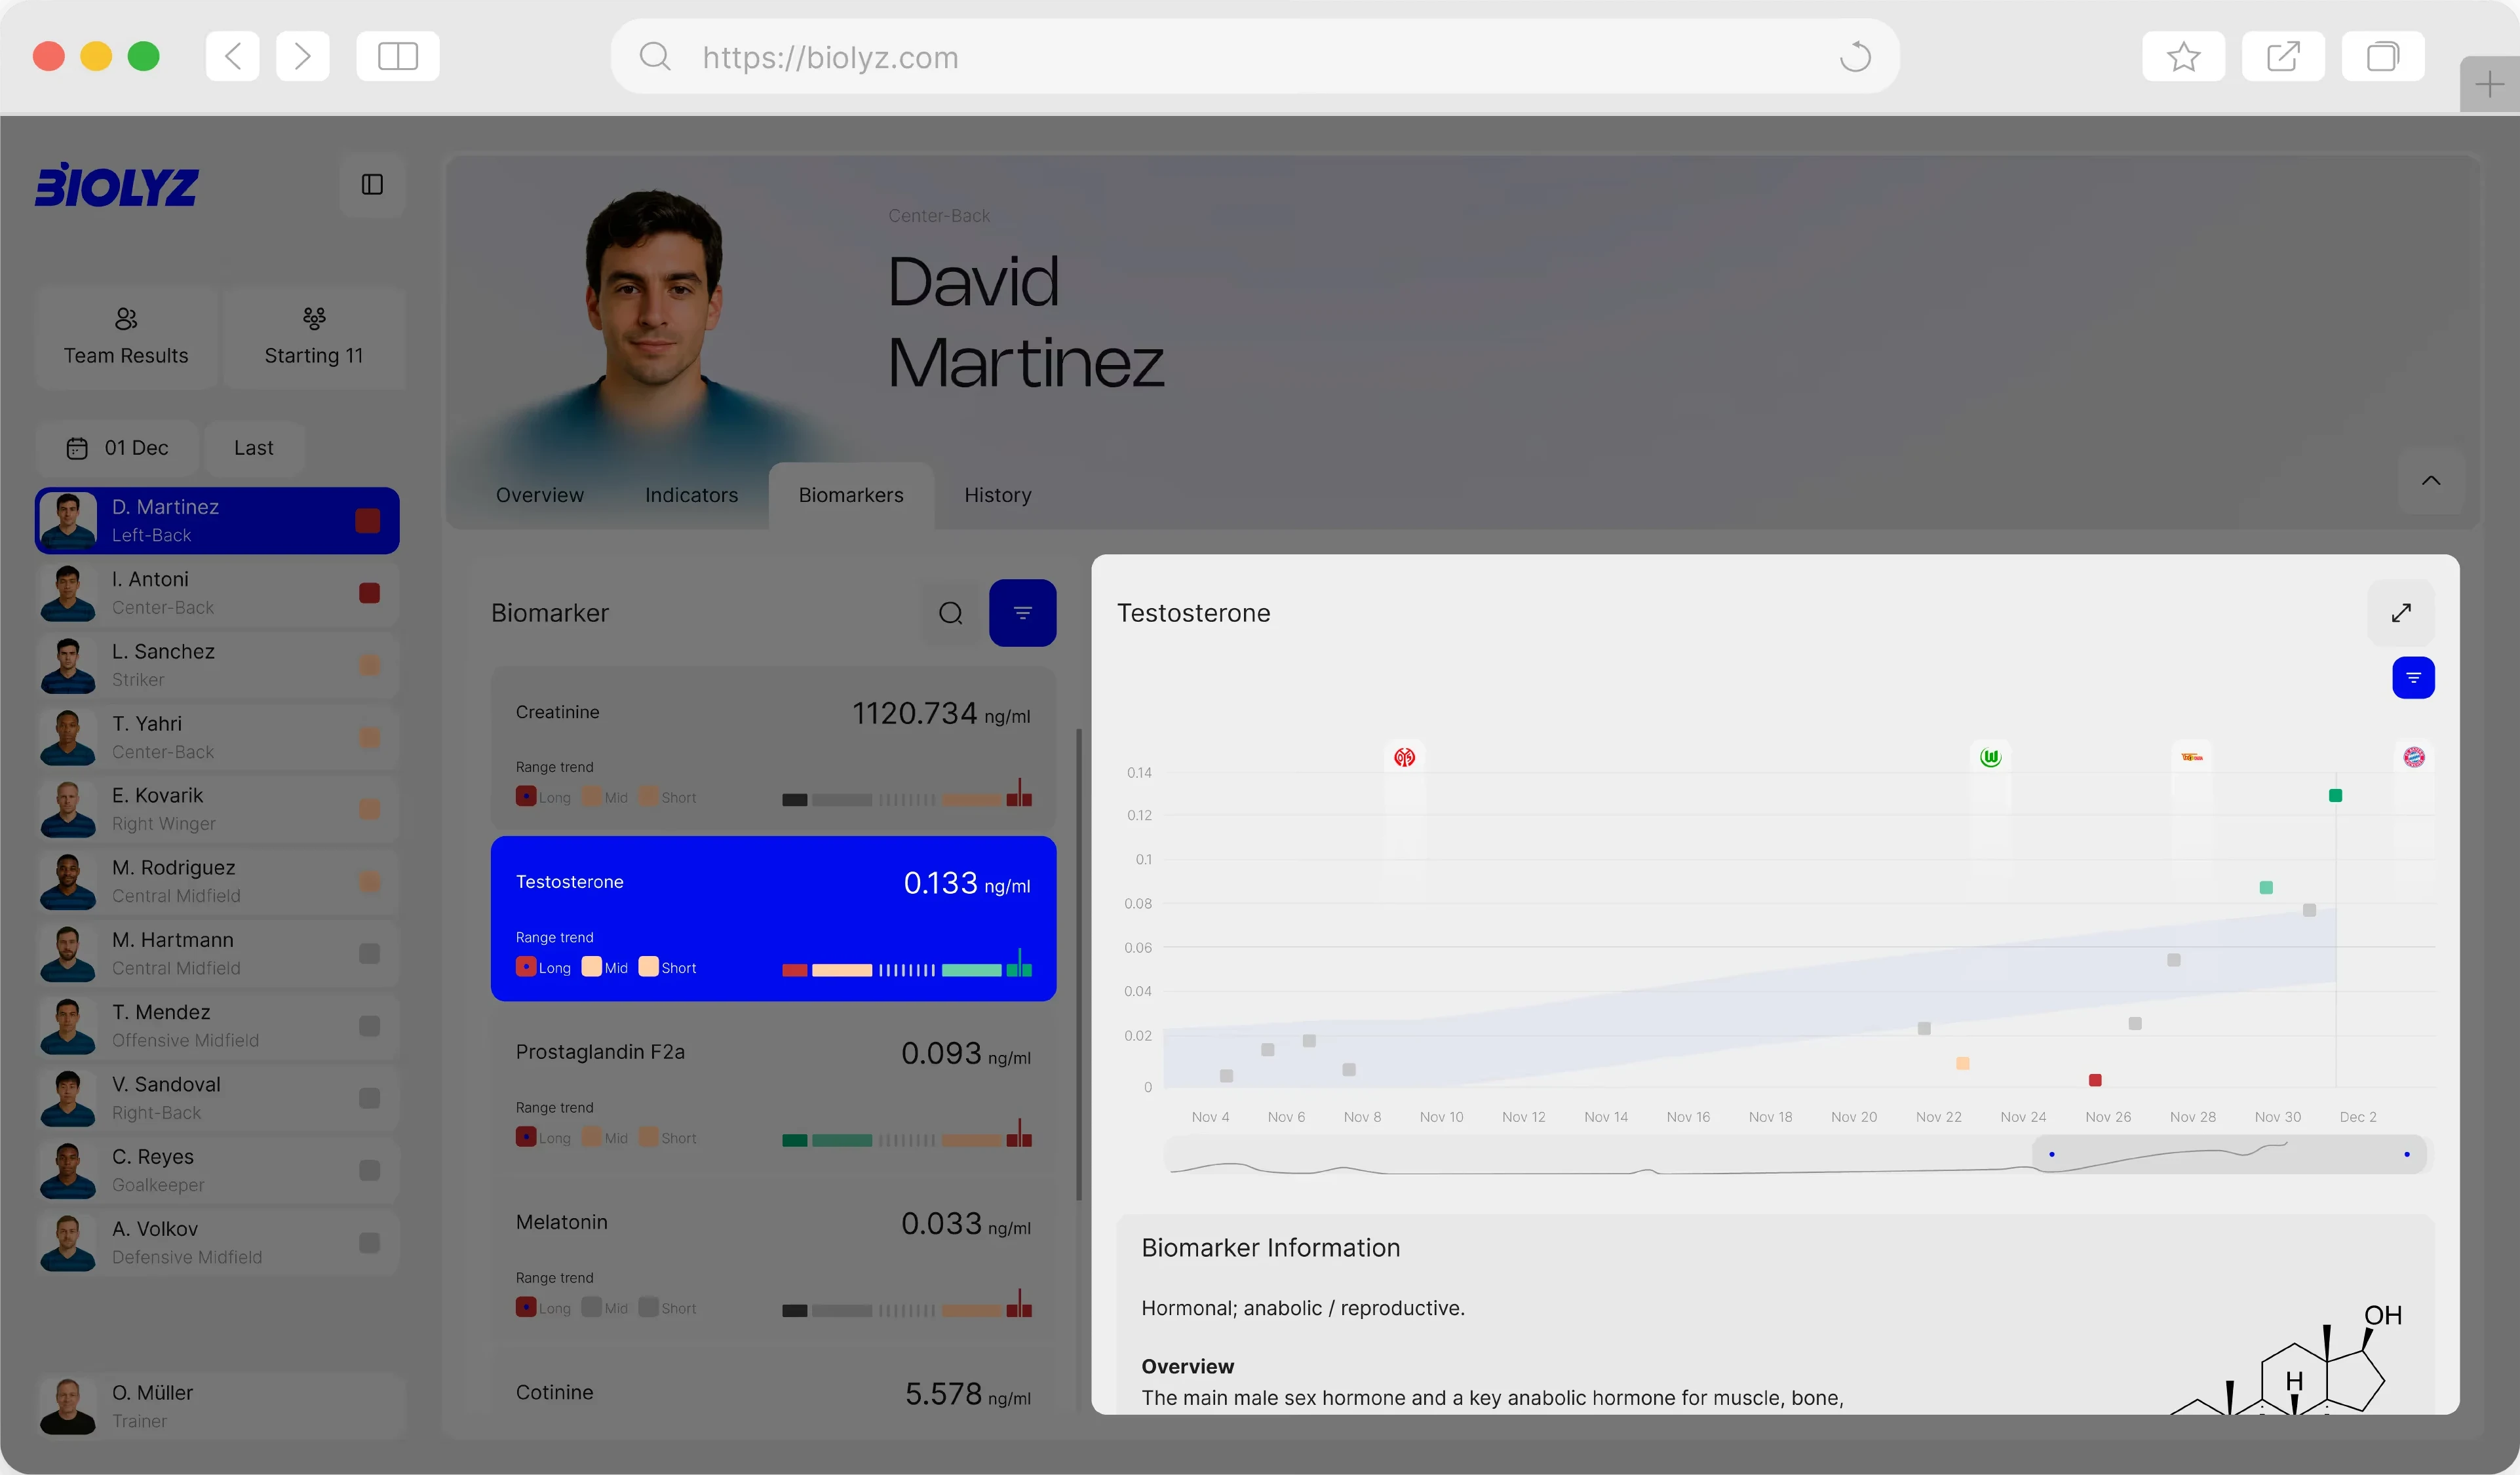
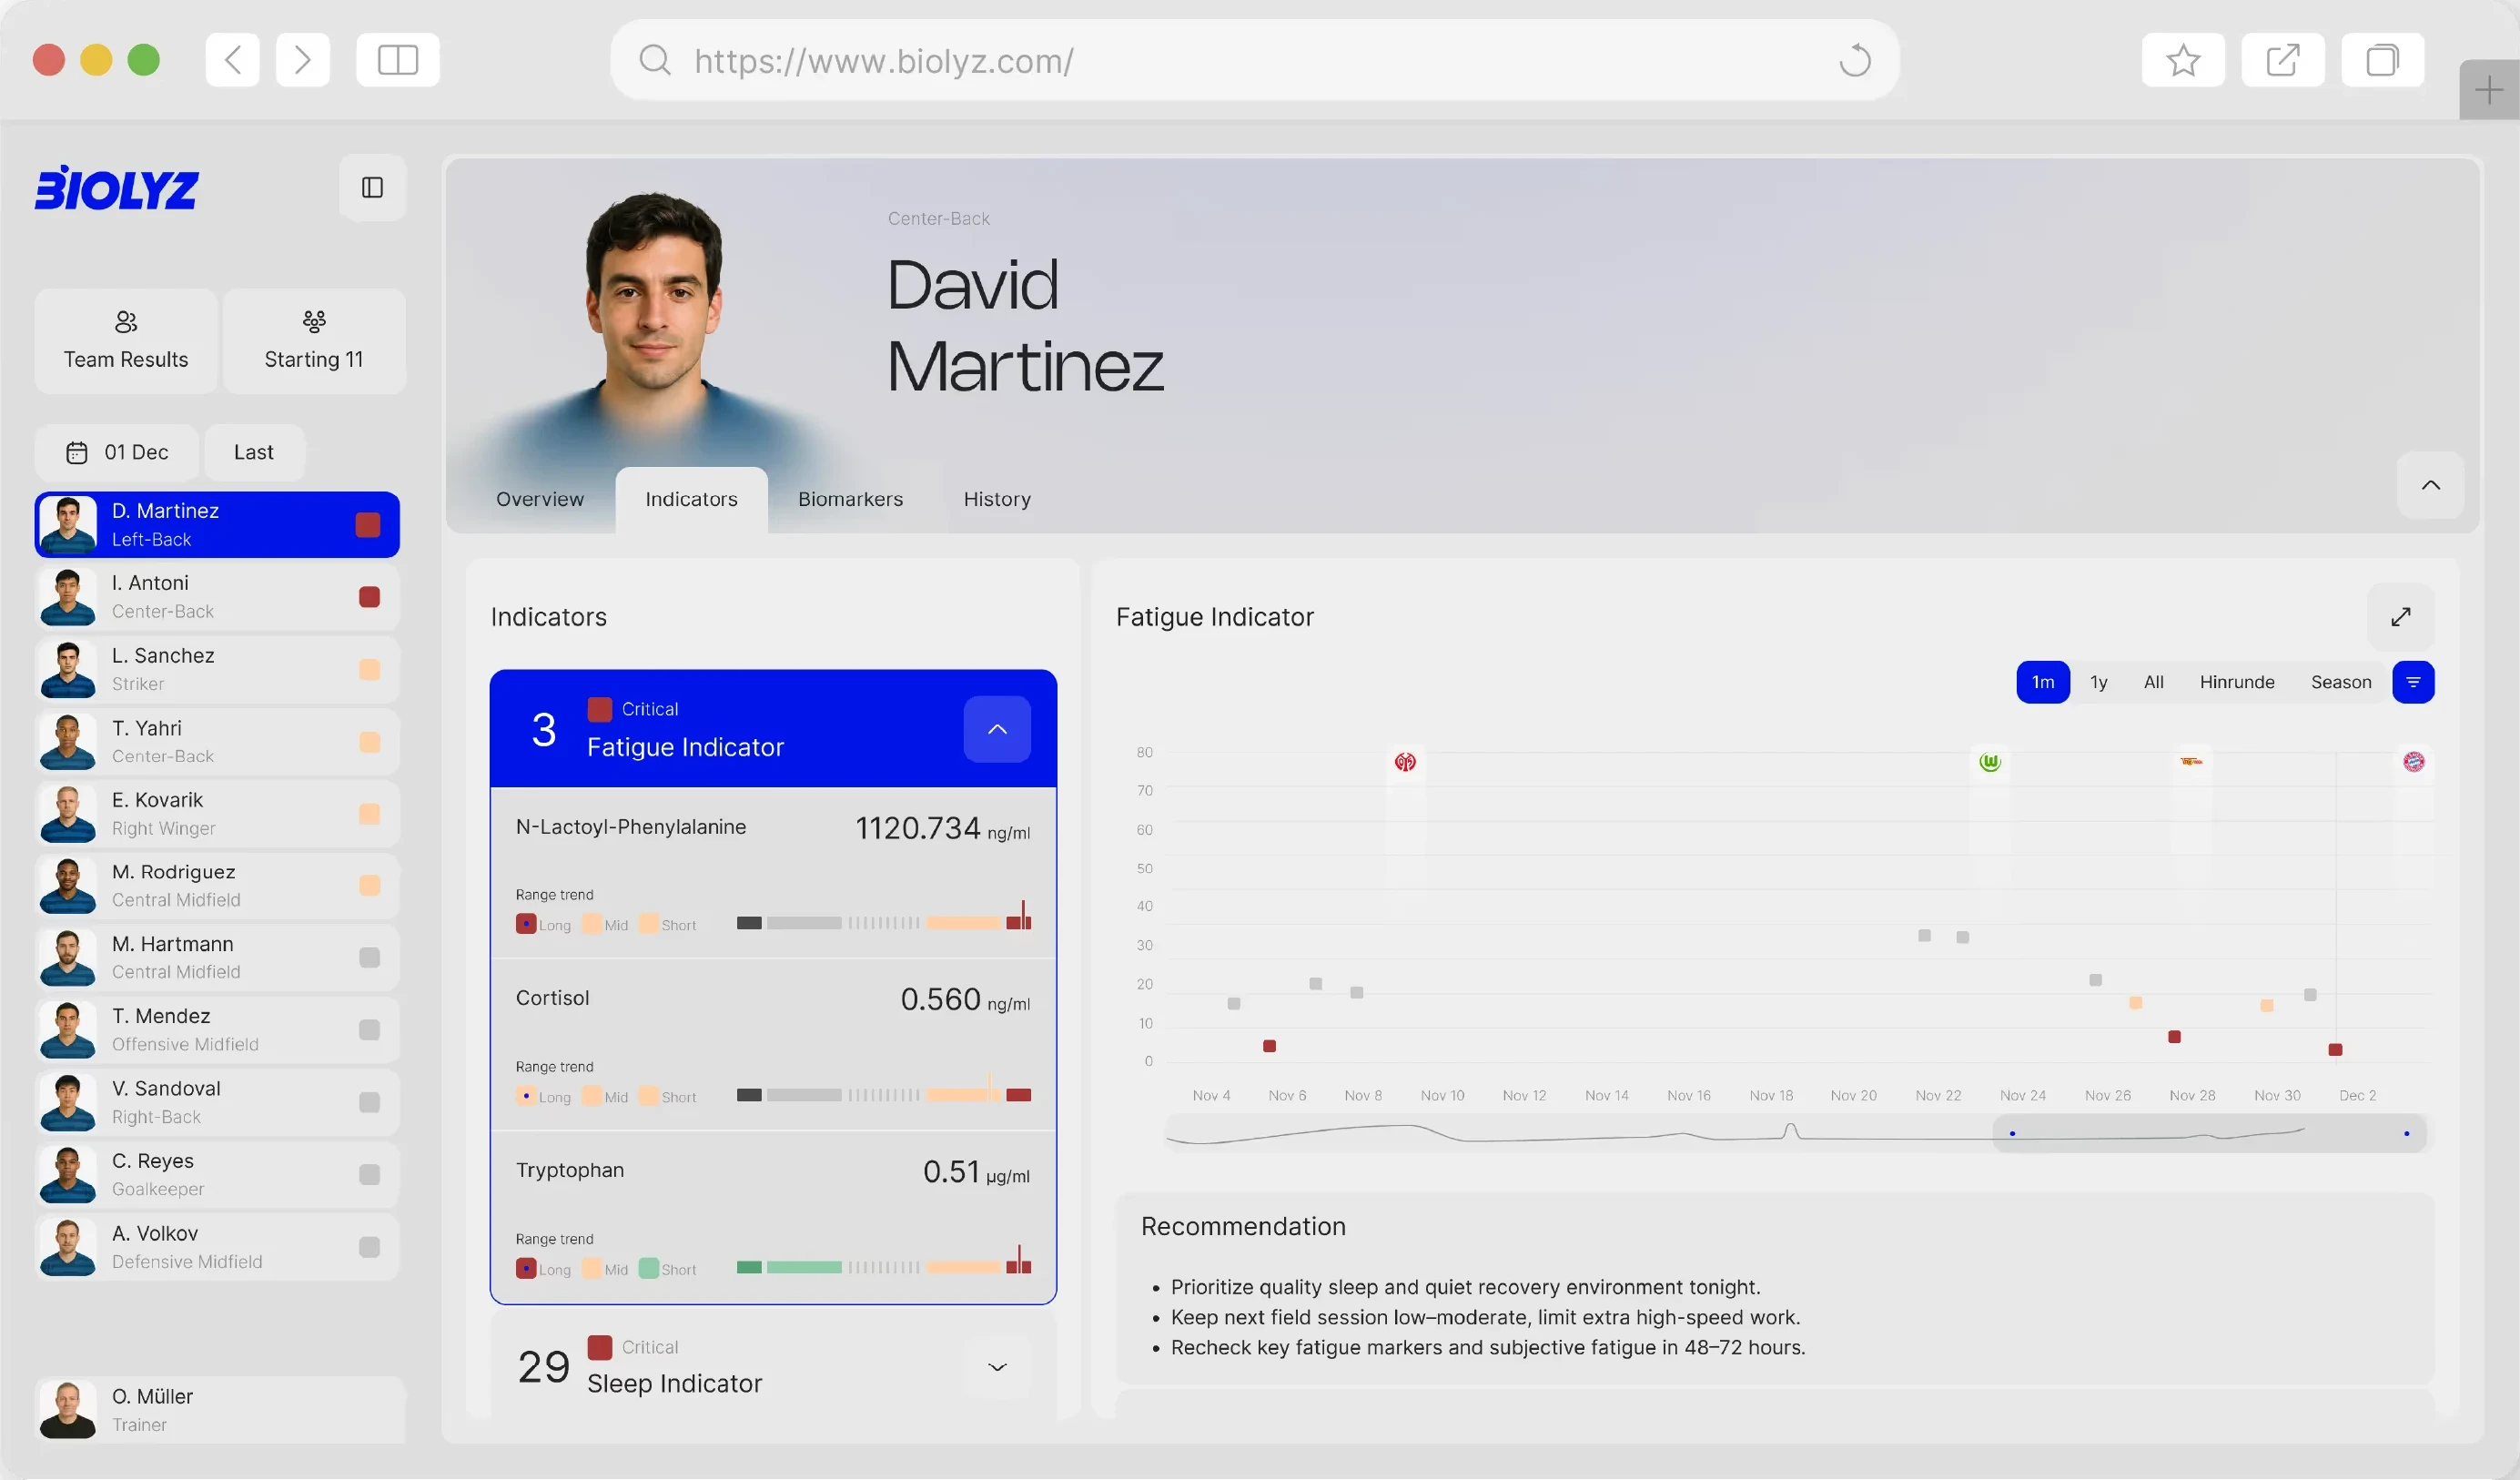
Every signal. One saliva sample.
Biolyz turns a single morning sample into the decisions performance staff make every day: what the body absorbed, how it’s coping, and exactly what to do about it. Not more data. The so what.
Recovery
How fast each athlete clears yesterday's work, and when they're ready to be pushed again.
What question is answeredHas this athlete recovered enough to be pushed again today, or do they still need rest?
How it worksWe leverage ML models to build a recovery score that is tailored to each team and more specifically to each athlete. Hence, it is possible to see how each athlete recovers, when they can be pushed and when prolonged rest is necessary.
The so whatRecovery is individual and changes daily. Training an athlete who hasn't recovered doesn't build fitness; it digs a deeper hole. A clear, personalised curve turns “how do you feel?” into a decision you can defend.
- Understand recovery values and understand strain
- Personalise recovery protocols to those who actually need them
- Manage return-to-play with data, not gut feel
Context. Context. Context.
Biolyz connects to the tools your performance staff already run. We ingest, normalize and validate the data, then route it straight into your dashboard alongside biomarker results: contextualising internal load with external signals for one complete picture.
Truth hurts? Not anymore.
No pain, plenty of gain. Simple, non-invasive testing results in information rich, longitudinal data.
Load and injury prediction becomes everyday business, not an unattainable hassle.

Non-invasive
A painless saliva swab replaces blood draws and finger pricks. Athletes collect a sample in under a minute — no needles, no staff, no downtime. Testing never interrupts training.

High-frequency
Collection is effortless, so testing can happen daily or even session by session. Long lab cycles become a continuous performance feed — more granular data, sharper prognostics.

Proprietary process
Our custom mass spectrometry platform reads a wider biomarker spectrum at clinical grade precision. Owning the hardware and chemistry end to end keeps data quality high.

AI Recommendations
Machine learning turns raw biomarker data into plain language actions — adjust load, boost recovery, tweak nutrition — tailored to each athlete. Coaches get predictive alerts before fatigue becomes injury, all in one dashboard.

Get in touch
Schedule a quick call to learn how Biolyz can turn your team’s saliva into a powerful advantage.
Contact Us